Why the Shape of Data Matters
After learning how to summarize data using descriptive statistics, the next step is understanding how the data is distributed. While averages and summary measures provide useful information, they do not fully explain how values behave across the dataset.
Two datasets may have the same mean and median yet look completely different when visualized. One may be balanced and symmetrical, while another may contain clusters, long tails, or extreme values.
This overall pattern is known as the distribution of the data.
Understanding distributions is one of the most important aspects of Exploratory Data Analysis (EDA). It helps reveal how values are spread, where most observations are concentrated, and whether unusual patterns exist.
Distribution analysis provides deeper insight into the structure and behavior of the dataset, allowing more accurate interpretation and better decision-making.
What is Data Distribution?
A data distribution describes how values are spread across a dataset. It shows:
- Where most values occur
- How frequently values appear
- Whether values are balanced or skewed
- Whether extreme values are present
Distribution analysis transforms raw numbers into visible patterns.
Instead of looking at individual observations one by one, distributions help identify the overall shape of the data.
Why Distribution Analysis is Important
Distribution analysis plays a critical role in understanding datasets because many analytical methods assume certain types of distributions.
By studying the distribution, you can:
- Detect skewness and imbalance
- Identify unusual values or outliers
- Understand variability more clearly
- Choose appropriate statistical methods
- Improve interpretation of averages and summaries
For example, income data often appears heavily skewed because a small number of individuals earn significantly more than the rest. In contrast, exam scores in a well-balanced class may follow a more symmetrical distribution.
Recognizing these differences helps prevent misleading conclusions.
Types of Data Distributions
Different datasets exhibit different shapes depending on the nature of the data.
The most common types of distributions include:
- Normal distribution
- Right-skewed distribution
- Left-skewed distribution
- Uniform distribution
- Bimodal distribution
Each type reveals different characteristics about the dataset.
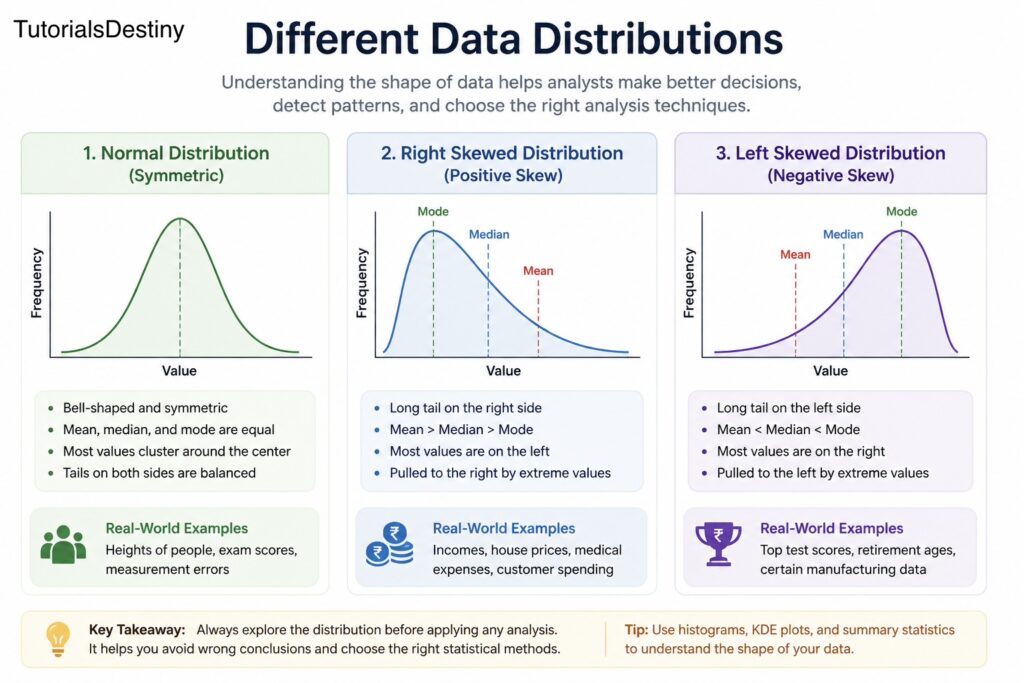
Normal Distribution
The normal distribution is one of the most important and widely studied distributions in statistics.
It is often called the bell-shaped curve because of its symmetrical appearance.
Gaussian Distribution Explorer
Explore how the mean (μ) shifts the bell curve and how the standard deviation (σ) changes its spread.
Mean (μ)
μ = 0
Standard Deviation (σ)
σ = 1
This distribution appears in statistics, probability theory, machine learning, error modeling, and natural phenomena.
In a normal distribution:
- Most values cluster around the center
- The left and right sides are balanced
- Mean, median, and mode are approximately equal
Characteristics of Normal Distribution
A normal distribution has several important properties:
- Symmetrical shape
- Single central peak
- Gradual decrease on both sides
- Predictable spread around the mean
Many natural and real-world phenomena approximate a normal distribution, including:
- Human height
- Measurement errors
- IQ scores
- Certain biological measurements
Real-World Importance of Normal Distribution
The normal distribution is important because many statistical methods assume data follows this pattern.
For example:
- Confidence intervals
- Hypothesis testing
- Regression analysis
When data is normally distributed, interpretation becomes easier and more predictable.
Skewed Distributions
Not all datasets are balanced. In many real-world situations, values tend to cluster on one side while stretching toward the other.
This creates skewness.
Skewness refers to the asymmetry of a distribution.
There are two main types:
- Right skew (positive skew)
- Left skew (negative skew)
Right-Skewed Distribution
A right-skewed distribution has a long tail extending toward higher values.
\[\text{Mean} > \text{Median} > \text{Mode}\]
In this distribution:
- Most values are concentrated on the left
- A small number of high values pull the distribution to the right
Examples of Right-Skewed Data
Right skew appears frequently in business and economics.
Examples include:
- Income distribution
- House prices
- Online followers
- Customer spending
In these cases, a few extremely high values create a long right tail.
Why Right Skew Matters
When data is right-skewed:
- The mean becomes larger than the median
- Averages may appear misleading
- Outliers strongly influence analysis
This is why understanding the shape of the data is essential before interpreting summary statistics.
Left-Skewed Distribution
A left-skewed distribution has a long tail extending toward lower values.
\[\text{Mean} < \text{Median} < \text{Mode}\]
In this distribution:
- Most values are concentrated on the right
- A few unusually low values pull the distribution leftward
Examples of Left-Skewed Data
Left-skewed distributions are less common but still important.
Examples include:
- Retirement ages in certain professions
- Scores on very easy exams
- Manufacturing quality metrics with occasional low failures
Understanding left skew helps identify situations where lower extreme values influence the dataset.
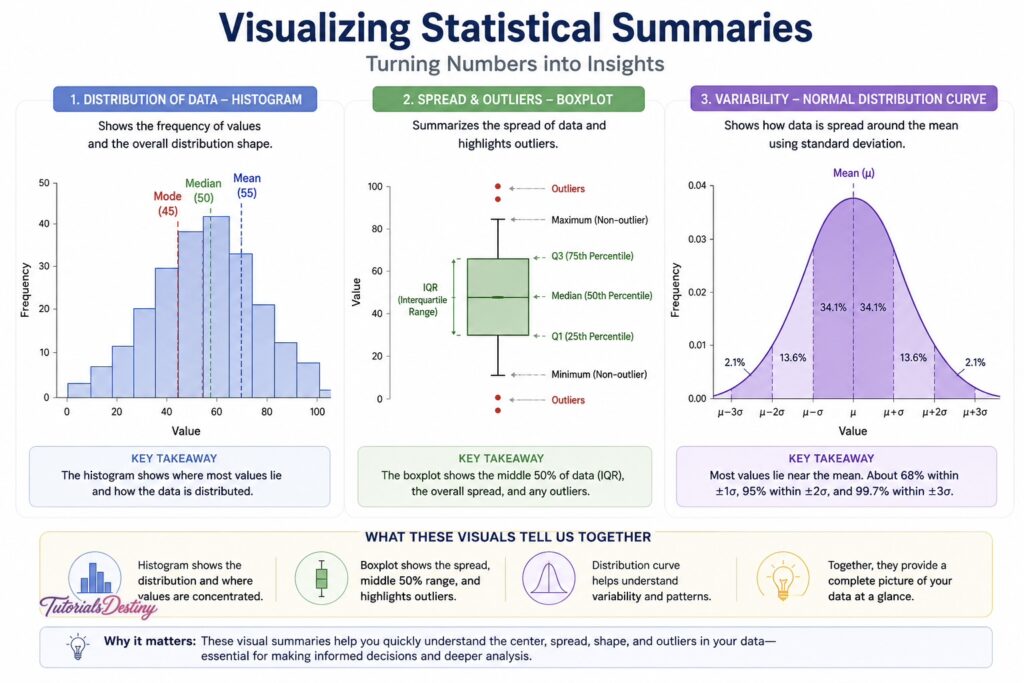
Visualizing Distributions
Visualizations are essential for understanding distribution patterns.
Charts make it easier to identify:
- Symmetry
- Skewness
- Clusters
- Outliers
- Spread
Two of the most common visualization tools are:
- Histograms
- KDE plots
Histograms
A histogram groups numerical values into intervals called bins and displays their frequency.
Histograms help answer questions such as:
- Where are most values concentrated?
- Is the distribution balanced?
- Are there gaps or clusters?
They provide a quick overview of how the dataset behaves.
KDE Plots (Kernel Density Estimation)
KDE plots are smoother versions of histograms.
Instead of showing bars, KDE plots create a continuous curve representing the density of the data.
KDE plots help visualize:
- Peaks in the distribution
- Shape and smoothness
- Density concentration
They are especially useful for comparing multiple distributions.
Understanding Skewness
Skewness measures the degree of asymmetry in a dataset.
Interpretation:
- Skewness ≈ 0 → symmetrical distribution
- Positive skewness → right skew
- Negative skewness → left skew
Skewness helps quantify patterns that may already be visible through visualization.
Understanding Kurtosis
Kurtosis measures how sharply peaked or flat a distribution appears.
\[\text{Kurtosis} = \frac{E[(X-\mu)^4]}{\sigma^4}\]
A high kurtosis indicates:
- Sharper peaks
- Heavier tails
- More extreme values
A low kurtosis indicates:
- Flatter distributions
- Fewer extreme values
Kurtosis provides additional insight into the behavior of the dataset.
Real-World Interpretation of Distributions
Understanding distributions is not just a statistical exercise—it has practical importance.
For example:
- In finance, skewed returns may indicate investment risk
- In healthcare, unusual distributions may reveal abnormal conditions
- In e-commerce, customer spending patterns may reveal valuable segments
Distributions help organizations interpret behavior, identify risks, and make better decisions.
Common Mistakes in Distribution Analysis
One common mistake is assuming all data follows a normal distribution. Many real-world datasets are skewed or irregular.
Another mistake is relying only on averages without examining the distribution shape.
Ignoring outliers is also problematic, as extreme values may significantly affect the interpretation of the dataset.
Finally, poor visualization choices can hide important patterns rather than reveal them.
A Practical Example
Imagine an online store analyzing customer purchase amounts.
The average order value may appear high, suggesting strong spending behavior.
However, when the distribution is visualized, the company discovers:
- Most customers place small orders
- A few premium customers place extremely large orders
The distribution is heavily right-skewed.
This insight changes interpretation significantly. Instead of treating all customers equally, the company may focus on retaining premium buyers while also improving engagement among regular customers.
Distribution Analysis in EDA Workflow
Distribution analysis is a core part of Exploratory Data Analysis because it helps reveal the true structure of the data.
It supports:
- Better interpretation of descriptive statistics
- Identification of unusual patterns
- Improved feature engineering
- More accurate modeling decisions
Without understanding distributions, many analytical conclusions become incomplete or misleading.
Preparing for the Next Topic
In the next topic, you will explore relationships between variables through correlation analysis.
You will learn:
- Correlation basics
- Correlation matrices
- Heatmaps
- Difference between correlation and causation
- Confounding variables
This will help you understand how variables interact within a dataset.
Final Thoughts
Distribution analysis provides a deeper understanding of how data behaves. It reveals patterns that averages alone cannot capture and helps identify skewness, variability, and unusual observations.
By learning to interpret distributions correctly, you improve your ability to analyze datasets accurately and make informed decisions.
As you continue through this module, distribution analysis will become one of the most valuable tools in your EDA workflow.
What You Should Take Away
By the end of this topic, you should be able to:
- Understand what data distributions represent
- Differentiate between normal and skewed distributions
- Interpret histograms and KDE plots
- Recognize skewness and kurtosis
- Apply distribution analysis in real-world scenarios
Next Topic
Correlation vs Causation: Understanding Relationships in Data
In the next topic, you will learn how variables interact and why correlation does not always imply causation.