Why Understanding Data Comes Before Everything Else
In today’s digital environment, data is generated at an unprecedented scale. Every transaction, click, interaction, and system event produces data that organizations collect and store. This abundance of data creates an opportunity—but also a challenge. The challenge is not in collecting data, but in understanding it.
Many beginners assume that once data is available, the next step is to apply algorithms or build models. However, experienced practitioners know that this approach often leads to unreliable outcomes. Without understanding the structure, quality, and behavior of the data, any analysis built on top of it becomes fragile.
This is why Exploratory Data Analysis (EDA) is not just an optional step—it is a foundational requirement.
EDA is the stage where raw numbers begin to form patterns, and those patterns begin to tell a story. Instead of rushing toward conclusions, it encourages careful observation and structured exploration.
What is Exploratory Data Analysis?
Exploratory Data Analysis is the process of examining a dataset to understand its main characteristics, uncover patterns, detect anomalies, and identify relationships between variables.
It combines statistical thinking with visual interpretation, allowing you to move from raw data to meaningful understanding.
At its core, EDA represents a transformation. Data begins as isolated values but gradually evolves into structured insights that can support decisions. This transition is not automatic—it requires deliberate exploration and interpretation.
EDA helps answer foundational questions:
- What kind of data is present?
- How are values distributed?
- Are there inconsistencies or missing entries?
- Do variables show meaningful relationships?
By answering these questions, the dataset becomes easier to understand and work with.
Types of Exploration in EDA
EDA involves examining data from multiple perspectives to gain a comprehensive view.
- Understanding Individual Variables: Each variable is studied separately to understand its range, distribution, and characteristics.
- Comparing Groups; Data is divided into categories to observe differences between groups.
- Exploring Relationships: Connections between variables are examined to see how they influence each other.
- Identifying Unusual Values: Extreme or unexpected values are analyzed to determine whether they represent errors or important observations.
Each of these perspectives contributes to a deeper understanding of the dataset.
Where EDA Fits in the Data Workflow
EDA plays a central role in the overall data workflow. It acts as a bridge between raw data and deeper analysis.
A typical workflow includes data collection, cleaning, exploration, analysis, and communication. Among these stages, EDA is where the dataset begins to make sense.
Without this step, important details may remain hidden. Patterns may go unnoticed, and errors may persist into later stages. A well-executed EDA ensures that the data is reliable and that the analysis built on it is meaningful.
The Purpose of Exploratory Data Analysis
The goal of EDA is to develop a clear and accurate understanding of the dataset. This involves examining both its structure and its behavior.
EDA helps to:
- Identify different types of variables
- Detect missing or inconsistent values
- Understand how values are distributed
- Recognize patterns and trends
- Explore relationships between variables
These elements combine to create a comprehensive view of the data.
The Role of Questions in EDA
EDA is guided by questions. The depth of understanding you achieve depends on the quality of the questions you ask.
At first, questions may focus on basic structure and summary. Over time, they evolve into more refined inquiries that explore patterns, relationships, and differences.
For example, instead of asking only for averages, it is often more useful to explore how values differ across groups or how they change over time.
This process transforms EDA into an active exploration rather than a passive observation.
From Raw Data to Meaningful Understanding
At the beginning of any data project, a dataset may appear as a collection of unrelated values. Through EDA, these values begin to reveal patterns and structure.
One of the key aspects of this transformation is understanding how data is distributed. Some datasets are balanced and centered, while others are skewed due to real-world factors such as income variation or user behavior.
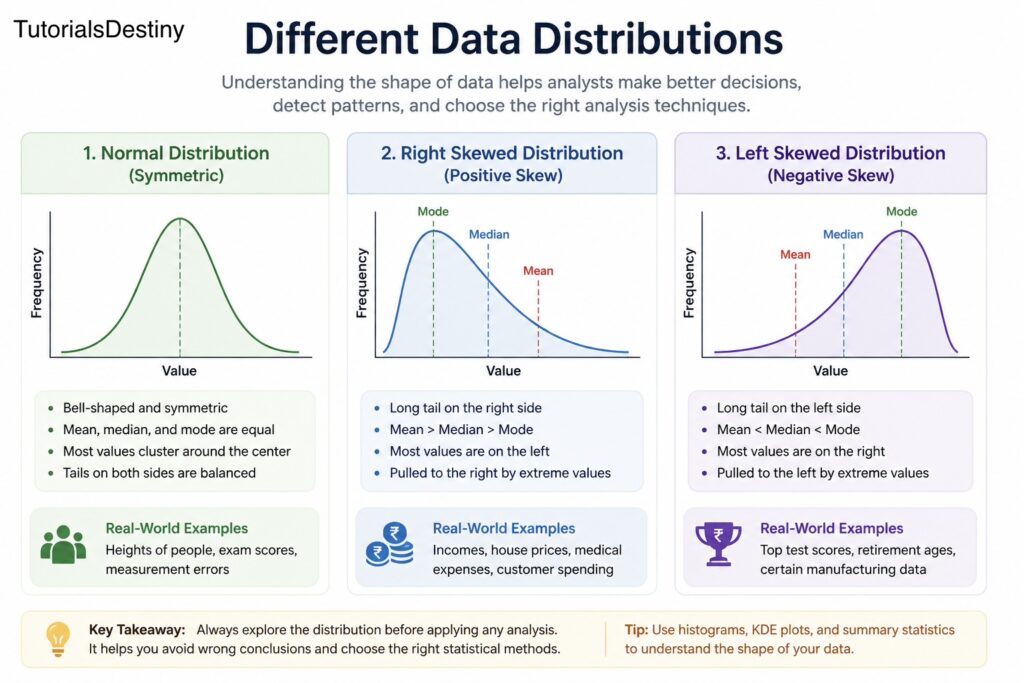
Recognizing these patterns helps prevent incorrect interpretations and supports better decision-making in later stages.
Exploring Data from Multiple Perspectives
EDA involves examining data from different angles to build a complete understanding.
One approach focuses on individual variables, analyzing their range and distribution. Another involves comparing groups to identify differences between categories. Relationships between variables are also explored to understand how they influence each other.
In addition, unusual values are identified and examined. These may represent errors or important observations, depending on the context.
By combining these perspectives, EDA provides a well-rounded view of the dataset.
The Importance of Visualization
Visualization is a powerful tool in EDA. It allows complex data to be presented in a way that is easy to interpret.
Through charts and graphs, patterns become more visible. Trends, clusters, and outliers can be identified quickly, making it easier to understand the data.
Visualization also improves communication. It allows insights to be shared clearly, even with those who may not be familiar with the underlying data.
Visual tools help to:
- Identify trends and patterns
- Compare values across categories
- Detect outliers or anomalies
- Understand distributions
A Real-World Example: Customer Behavior
To understand how EDA works in practice, consider a dataset containing customer information such as income, spending, and purchase frequency.
Initially, the dataset may appear complex. Through exploration, patterns begin to emerge. You may find that certain groups spend more, or that spending varies across different regions.
You may also discover that some values are unusually high or low, prompting further investigation. These observations gradually build a clearer understanding of customer behavior.
This example highlights how EDA transforms raw data into meaningful insights.
Common Challenges in EDA
While EDA is essential, it requires careful execution.
Missing data can affect accuracy and must be handled appropriately. Patterns must be interpreted cautiously, as not all patterns are meaningful. Data quality issues such as errors or inconsistencies can distort analysis if not addressed.
There is also the risk of bias. It is important to approach data with an open perspective and rely on evidence rather than assumptions.
Being aware of these challenges helps ensure that EDA remains reliable and effective.
EDA as a Foundation for Further Analysis
EDA prepares the dataset for deeper analysis. It ensures that the data is clean, consistent, and well-understood.
Without EDA, analysis may be based on incomplete or misleading information. With EDA, patterns are identified, relationships are understood, and potential issues are resolved.
This makes EDA a critical foundation for any data-driven work.
The Iterative Nature of EDA
EDA is not a one-time activity. As new insights emerge, the process continues.
You may begin with a general overview, then focus on specific variables or patterns. Each step leads to new questions and deeper exploration.
This iterative approach allows for continuous refinement and a more complete understanding of the dataset.
A Guided Thinking Exercise
Imagine you are given a dataset containing product sales data.
Before using any tools, consider how you would explore it:
- What types of products are included?
- How are sales distributed across categories?
- Are there seasonal patterns?
- Which products perform consistently well?
This exercise highlights the importance of structured thinking in EDA. Defining the right questions is the first step toward meaningful analysis.
Preparing for What Comes Next
This topic lays the foundation for the rest of the module. In upcoming sections, you will explore techniques such as descriptive statistics, distribution analysis, and relationship analysis.
These techniques will build on the concepts introduced here and provide practical tools for exploring data effectively.
Final Thoughts
Exploratory Data Analysis is the starting point of meaningful data work. It transforms raw datasets into understandable information and provides clarity for further analysis.
By carefully examining data, identifying patterns, and exploring relationships, EDA enables deeper insights and more informed decisions.
What You Should Take Away
By the end of this topic, you should be able to:
- Understand the role of EDA in the data workflow
- Recognize the importance of exploring data before analysis
- Identify key aspects of a dataset
- Approach data systematically through exploration
- Build a strong foundation for further analysis
Next
Descriptive Statistics: Understanding Data Through Summary Measures
In the next topic, you will learn how to summarize and interpret data using statistical measures such as mean, median, mode, variance, standard deviation, and percentiles. You will also understand when averages can be misleading and how descriptive statistics help uncover the true nature of a dataset.
Leave a Reply